About a week prior to this post, I posted a two-fer video and paper combo.
Overall, the video and post got way more exposure than I anticipated, which is equal parts neat and scary! For those that wrote encouraging comments, gave feedback, or asked questions, I am super appreciative!
I wanted to use this week’s post to mention some followup items since the original posting, as well as some other forward-looking thoughts.
Ideas I missed
First, there are a couple important ideas/links worth sharing, both of which are now added to the original paper.
STB’s TrueType rasterizer and others
The first bit is that (unsurprising to me), the core idea of the Scanline Sweeper was implemented before in at least one place, as described by Sean Barrett here. Despite having used Sean’s TTF rasterizer before, I had never actually bothered to inspect how it actually worked so it was pretty cool to see a similar concept described on that page. For the record, I’m not even remotely surprised that sweeping signed areas has been done before – it’s almost too basic a concept not to have been done before. This is why I was pretty careful to hedge in my writing that I didn’t claim “originality.” All I could claim is that I hadn’t seen it before, and certainly not in a shader. For the record also, I’m not bummed about this! Ultimately, the broad shared experience of techniques and mathematics across humanity is really quite a lot to cover. What’s more important to me is less “was I the first to come up with it” and more “was I able to think through the problem, and come up with a working solution that I can share.”
Now that post from Sean (link again) links even more projects that I’m not familiar with as the original inspiration of the idea. I won’t link/cite them all here because I’m still not all that familiar with them, but in short, because I more or less focused on GPU-centric approaches to glyph rendering, I essentially remained unaware of this entire collection of rasterization approaches taken by other software rasterizers. I couldn’t tell you why some of these approaches didn’t make it to the GPU, as only a few modifications are needed to make it sufficiently fast in a shader.
Even though there is prior art, I think the paper/video still has some value, since if nothing else, it demonstrates that applying an idea in a new context (i.e. GPU) is feasible/possible with some implementation ideas. For me as an implementer, the hint that something is feasible is often the critical bit of inspiration needed, so I’m content if what I produced didn’t exceed this metric.
Sheared Footprints
Another paper brought to my attention after the original posting is Real-Time Analytic Antialiased Text for 3-D Environments from Ellis et. al. (paper link). This paper was a total oversight to me, but I’m super glad I got to read it, since it explains a pretty clever trick I hadn’t considered.
The core idea is fairly similar, with a few differences in the quadrature:
- The Ellis paper doesn’t assume monotonicity
- The Ellis paper also doesn’t rely on the Jordan curve theorem
Something both their approach and the sweeper have in common is the need to transform a pixel-footprint to font space, and in both cases horizontal alignment must be preserved. Here’s an excerpt from the original paper, with an image explaining how they do this:
Assuming a pixel footprint can be accurately approximated by a Gaussian, which is radial-symmetric, we compute a radial- symmetric sampling of the surface at a given pixel position.
…
Hence the rotational component of M is irrelevant, and we can use a QR factorization to decompose M into a rotation, which we ignore, and an upper-triangular shear matrix R that operates parallel to the x-axis, as shown in Figure 3.
Real-Time Analytic Antialiased Text for 3-D Environments Section 3.2 Domain Transformation
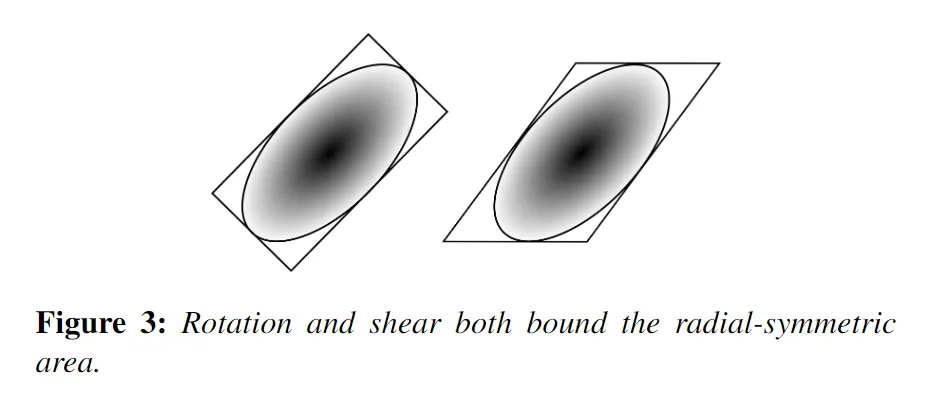 Image credit: Real-Time Analytic Antialiased Text for 3-D Environments
Very clever!
Now, if the quote above doesn’t immediately make a whole lot of sense, you’re probably just a few linear algebra facts away from appreciating this insight.
First, let’s remind ourselves some facts about matrix decompositions. As you likely know, matrices can be written as products of other matrices in an infinite number of ways. Some of those ways are “special” enough to have names assigned to them. The singular value decomposition is probably the most common one, and the QR decomposition is perhaps the most boring one. Namely, to do a QR decomposition, you essentially take the matrix , and split it into two factors. The first factor (called ) is the orthonormalized basis associated with , and the second factor (called ) is all the extra “stuff” needed to go from to . To compute the decomposition, you can apply a Gram-Schmidt orthonormalization procedure to compute the new orthonormal basis in terms of the old basis vectors. Then, the new orthonormal basis is , and the coefficients needed to express the vectors in terms of the vectors is .
Mini Desmos Tutorial
Now, let’s suppose this was all still gibberish to us, and we wanted to unpack what was going on. The tool I use quite frequently is Desmos. There is no substitute for actually just plugging in values into arbitrarily complex expressions, integrals, and other math gobbledy-gook to turn what appears to be nonsensical into concrete intuition. Before tools like Desmos existed, I would do this sort of thing by hand on graph paper with a pen that wrote well, but Desmos is a nice practical alternative. Since I think this is a valuable skill, let’s see how we can demo the idea described in the paper above with Desmos.
First, we need to come up with a strategy on how to visualize anything. I’ve been trained to think of matrices in terms of their action, so a natural thing to do is to construct a set of points that we’ll apply matrices to, as a way to visualize what these matrices are. In other words, matrices are “verbs,” so to explore them, lets make some nouns (points) and observe how matrices affect them.
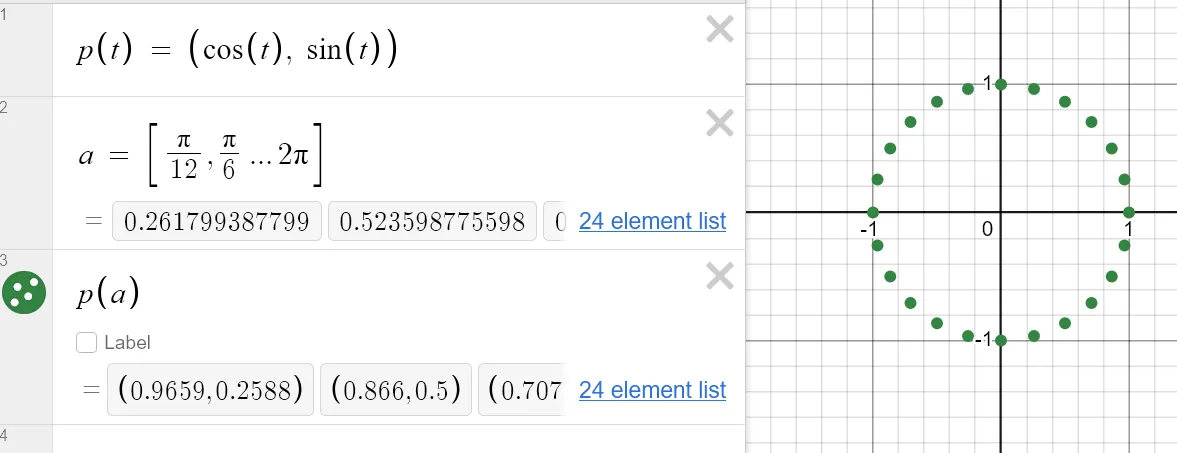
Above, I’ve defined a function which is just a parametric equation for a circle (parameterized by angle), a list of 12 angles spaced radians apart, and plotted a point for each angle. Why a circle? Because we know the region we want to sample at a given surface is a circular sample region that ultimately gets transformed and projected to the screen. We could have hardcoded a different set of points if we wanted also.
Next, we need some candidate matrix we can use to transform this circle. Desmos doesn’t directly support matrices, but it’s easy enough to roll our own:
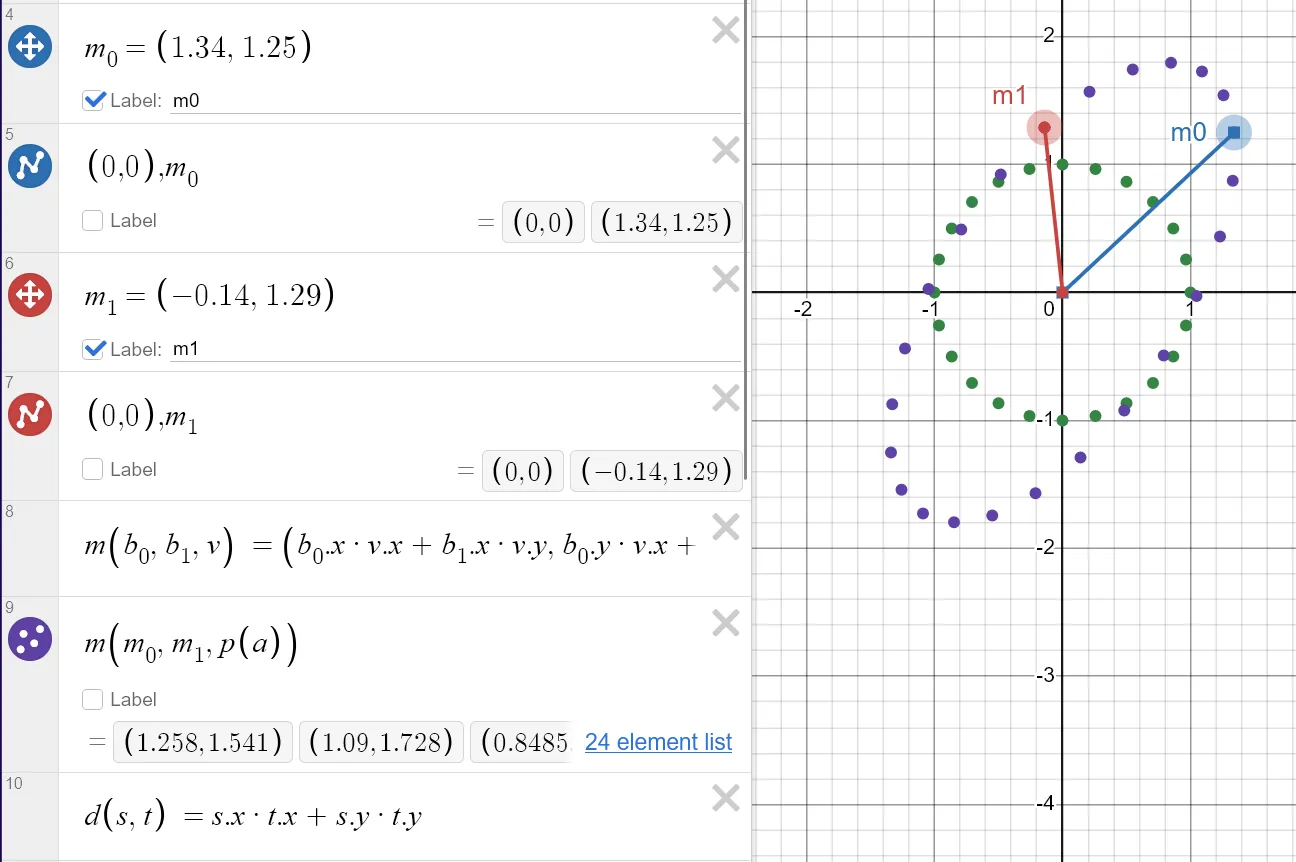
Here, and are the column vectors (basis) of the transform and is a function that performs the matrix action (aka, multiplying a matrix with a column vector). The purple points is the visualized consequence of transforming each point as an ellipse. Since and are paremeters, they can be dragged and moved around the canvas to shape the ellipse as we want. The image demonstrates how each of the 12 points around the circle map to 12 points on the ellipse after the application of . The function is a familiar dot product operation we’ll use later.
Let’s now see how the QR-decomposition works. We start by computing one of the basis vectors:
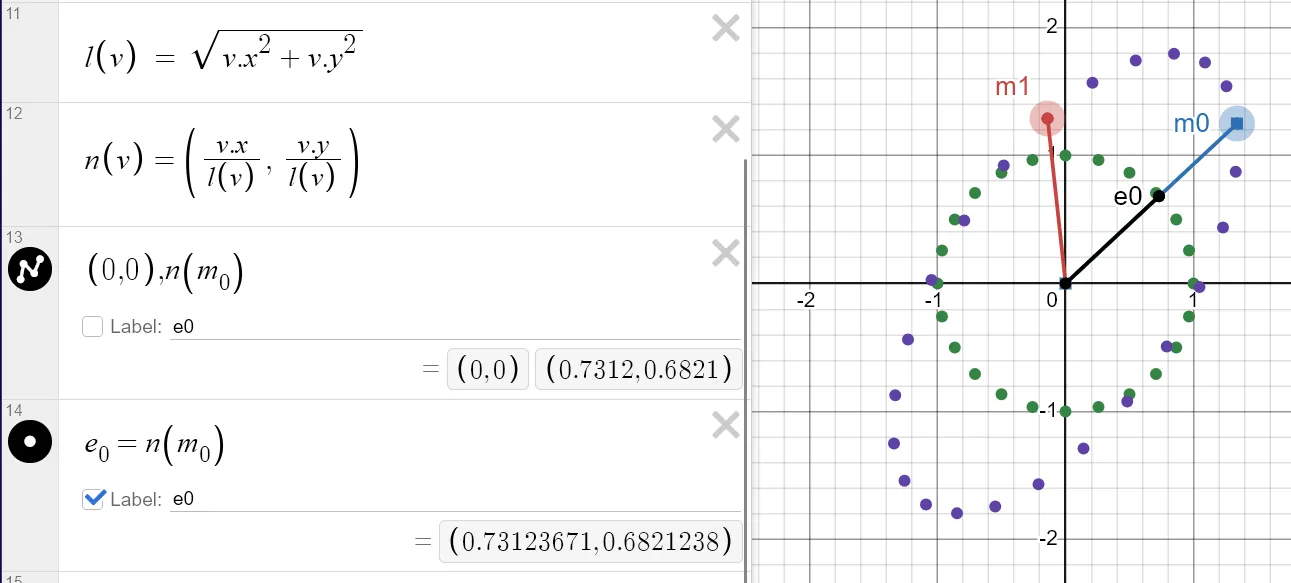
This one is easy enough, just normalize any arbitrary vector to get the first normalized basis vector of (call it ). Then, we can use this to construct an orthogonal basis vector by subtracting the projection of on .
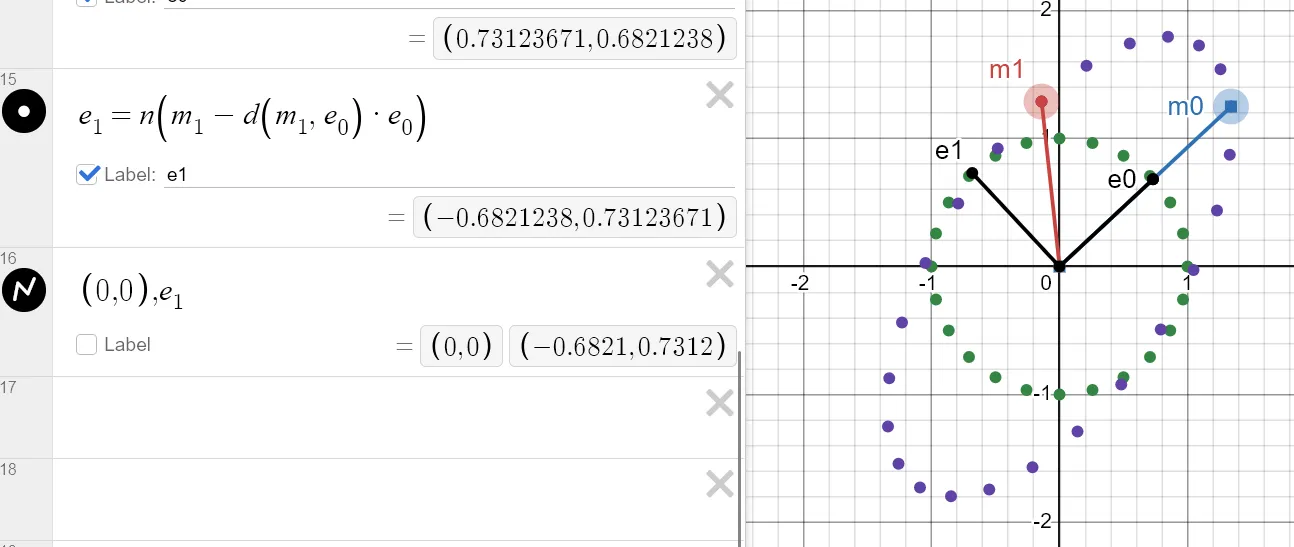
Visually speaking, it certainly seems like and constitute an orthonormal basis to me! That means that we have our matrix. The matrix now is easy and something you should never memorize. If you need to figure out what a matrix (aka a linear transformation) is, stay calm and just write out the actual linear system:
Nothing fancy here, just expressing both and in terms of our shiny new orthonormal basis and . From this, the matrix can be read off directly:
If you aren’t sure why the matrix product above maps to the linear system, it may be useful to remember the trick I’ve blogged about before, where it’s often productive to think of matrix elements as vector quantities, instead of constantly carrying around the mental baggage of all the components for each dimension in every matrix. In other words, think of the matrix product above as the product between a row vector and a matrix. When you get used to this way of thinking, matrices become far more ergonomic to work with.
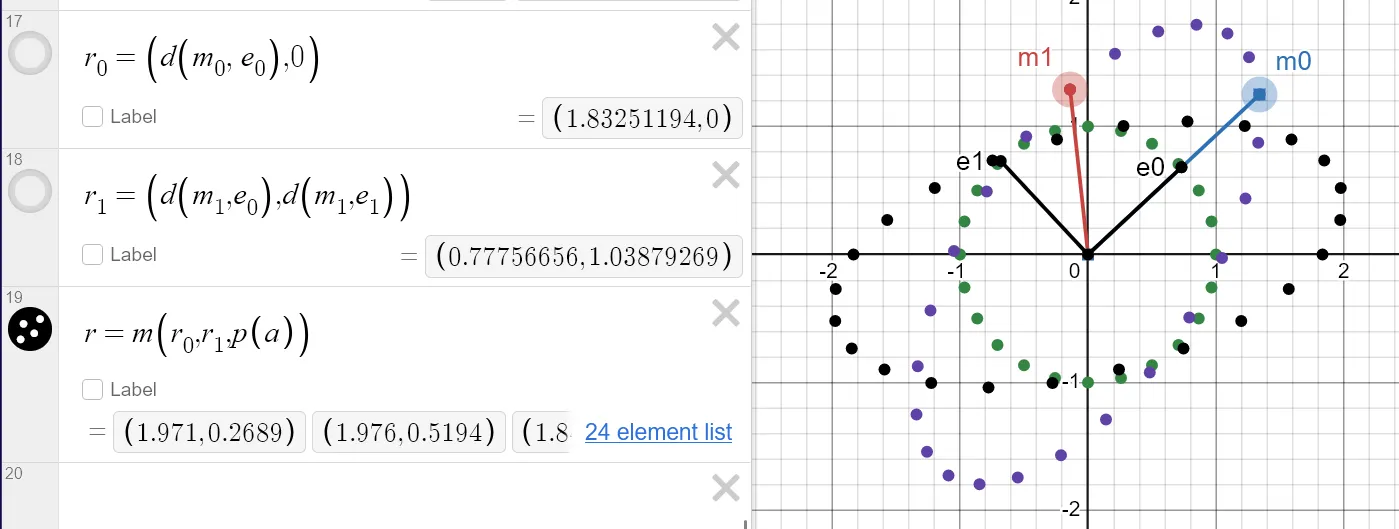
So, is our decomposition correct? Let’s visualize it! If we apply to the set of points in our circle, and then afterwards, we should end up with the same ellipse. Applying first gets us this rotated ellipse (black).
Finally, let’s apply and verify that we recover the original ellipse:
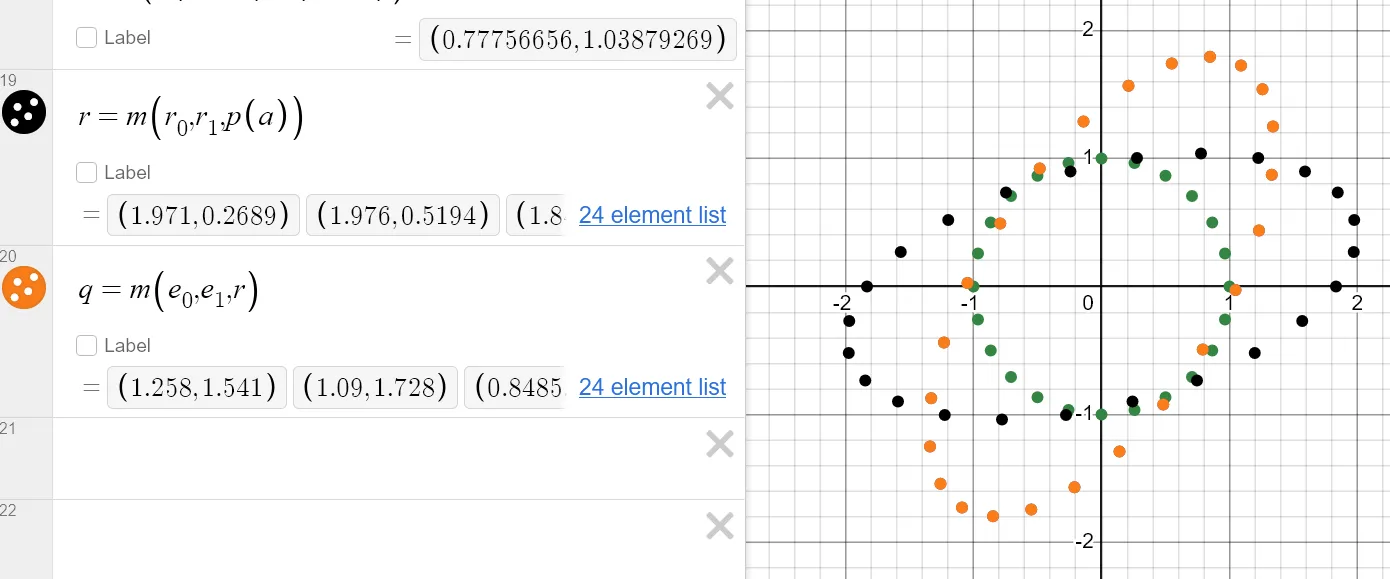
At this point, elements were getting harder to see, so I’ve simply hidden all labels and markers except our original 12 unit-circle points (green), the initial ellipse produced by the transform (drawn below the points in orange), the ellipse produced by the transform (black), and finally, the ellipse produced by the transform (orange) which completely occludes the original ellipse. As it should! After all, .
Now, we know that in this case in the pixel shader, the UV gradients are transformed surface gradients, that have been projected into screenspace, and our goal is to compute a transform that maps the ellipse back to the circle. That way, we can transform the Bézier control points into a space where the elliptical anisotropy is gone and we are operating in a nice uniform space. If we were to apply to the ellipse, we’d get our original set of points on the unit circle, but our goal is to maintain horizontal alignment and as the paper suggests, we can leverage our QR decomposition to do just that. The inverse of is , so let’s see what happens now when we apply by itself, without considering (here, and are the names I’ve given to the column vectors of ):
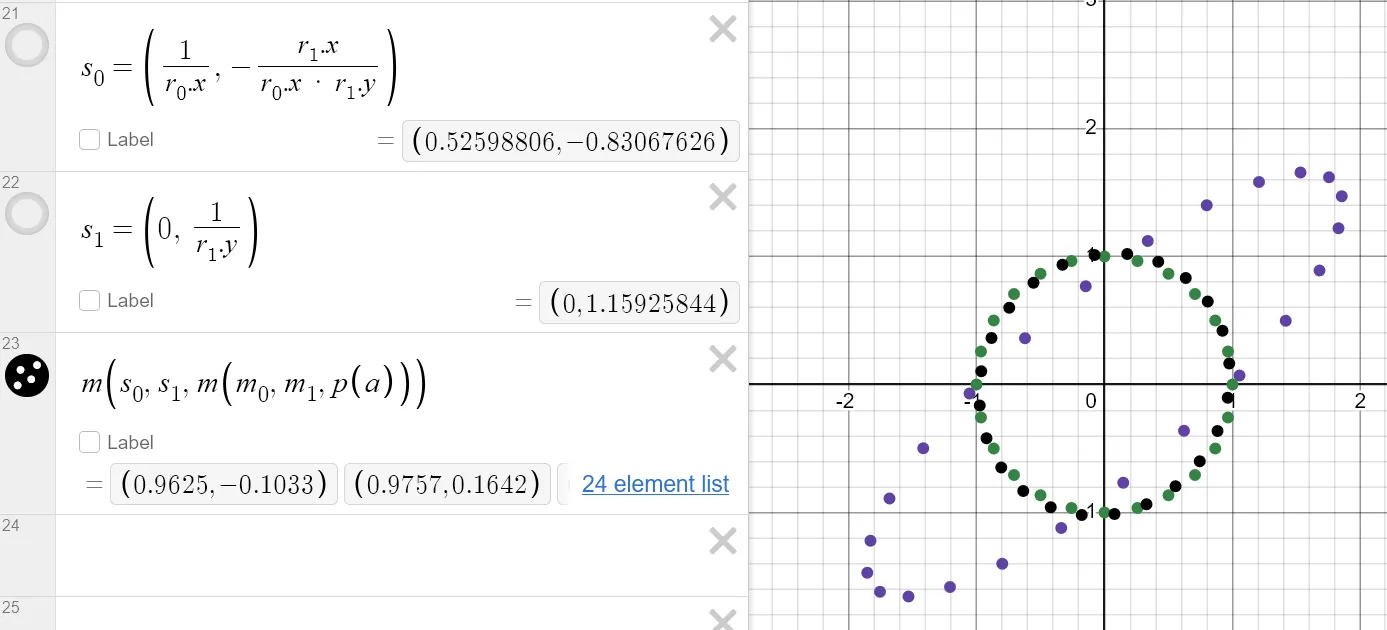
Et voilà! We have a transform that inverts the elliptical shape to produce our original unit circle, albeit with some rotation. This is expected since we didn’t first apply (if we did, we’d end up with our exact set of original points).
This was, arguably, an extremely longwinded way to explain a relatively straightforward concept, but I wanted to do this for a few reasons:
- First, I think this is a useful demonstration to show how mathematical intuition is built. Step-by-step, with trial and error, but more importantly, “playing” with actual quantities, diagrams, numbers, and so on.
- Second, every complex idea can be broken down into sufficiently small substeps, all of which can individually be easily understood. In fact, this is the most reliable way I know to understand anything complicated – just as a sequence of simpler substeps.
- Last, in my opinion, actually building demos, examples, and/or working through actual calculations is really the only way mathematical intuition is really calcified in your brain in a way that really sticks.
If you’d like to play around with this Desmos demo yourself, check out the link here.
Many times, when someone struggles to read a paper, it’s often because papers are written with a linguistically high context style. Definitions, theorems, and conventions are assumed by the paper author, and your comprehension of said paper depends quite a bit on the degree to which you understand that context. Restated in another way, if you don’t understand what a paper is saying, it doesn’t mean you’re “dumb” or lack the capability. Like most things, reading papers is a skill unto itself, so my usual strategy is to try to understand what context I’m missing when I get “stuck” reading something. It’s not a small amount of work, but over time, ideas in papers start to just resonate as your foundation grows, and visualizations like the demo above can happen more frequently in your mind’s eye while reading.
Scanline Sweeper changes?
Aside from amending the original paper (and video description) with some more links and attribution, I actually haven’t touched the implementation I showed in the video at all. In particular, while the footprint shear trick described above is quite neat, it also breaks horizontal monotonicity which I leverage to nominally improve the speed of the shader. While that isn’t important in and of itself, the main thing is that I don’t need better anisotropic/rotated sampling for what I’m doing, so I’m making do with the cheapest and simplest thing that I need.
If someone needed higher quality anisotropic/rotated sampling, the only changes needed to the sweeper are:
- At the preprocessing stage, curves no longer need to be split to be horizontally monotonic.
- In the pixel shader, the UV gradients should be used to compute the shear matrix as described above, which should be used to transform each control point. This replaces the previous method of computing window size and converting from screen space to font space.
- After shear is applied, the horizontal critical point should be located per-curve, and if it exists in the unit interval, a curve subdivision is needed.
- The rest of the algorithm can proceed as normal.
Since the shear transformation above doesn’t actually shift points vertically outside of a uniform scaling factor, vertical monotonicity is preserved, so that part of the algorithm works just the same.
Thoughts on publishing
The entire reason this site (and the video, or anything else I produce) exists is because I’ve learned that I get a fair bit of satisfaction helping others learn also. Selfishly, I also learn a fair bit in the process, so by publishing ideas, there’s a fair bit of benefit to go around.
Why the “paper”
The “paper” I’ve published is hopefully the first of many. Not a real paper in the sense that it exists in some official journal, but just an artifact I can share with others. It’s reasonable to ask why I made it in paper form to begin with. The answer can be summarized in the following points:
- There’s a spectrum between “random Discord message” to a “blog post” to a “paper” to a “book”. Moving right along the spectrum, the expectations of rigor and polish increase, but so too does the turnaround time.
- In this case (and in future cases also), I want to produce content that has more polish/care than a blog post, but not to the extent of rigor demanded by an actual scientific or mathematical publication. This type of content will be less frequent than these (approximately weekly) blog posts, but nowhere near the timescale of a typical research paper.
I don’t have a word for the “thing between a blog post and paper” yet, so for now, I’m just calling it a “paper” but with a hefty disclaimer right below the abstract that the paper isn’t peer reviewed, and that I will edit it from time to time as the described technique or subject is refined.
Who’s the audience?
Another question worth asking is, “what is the target audience for the video and paper?”
I’ve thought about this for a while prior to making the video, and I think my goal is to target intermediate to advanced game devs and graphics programmers, while still being at least moderately accessible to newer practitioners.
Reasons being:
- I think there is a really healthy amount of content already for newer practitioners.
- Focusing on more intermediate and advanced content is actually more personally motivating (and thus more sustainable).
- I’ve had the fortune of mentoring a number of very solid intermediate to senior-level game devs over the years, so I have a better “pulse” on what that group of individuals would find engaging or challenging.
Dodging the “paper trap”
This site and studio is set up to try and avoid a few pitfalls:
- I’m never going to sell a product based on these posts/papers.
- I’m never going to patent any ideas discussed in these posts/papers.
- All papers are published under the Rook & Possum pseudo-journal, by Rook (my pseudonym).
- I actually don’t anticipate to make any significant income from Patreon and Youtube. Being able to live off of these income sources really requires fulltime content creation, and I still plan to work on the game engine and game primarily, and the content secondarily.
By doing this, my hope is that the reader doesn’t have to worry about:
- … ideas that are misrepresented because I have something to sell you.
- … ideas that are misrepresented because I have an ego to protect.
Basically, content here is a fairly direct presentation of “what I did to solve some problem”, without the typical undertone that suggests what I did is the smartest or best or most novel way. None of this is going on a résumé for a future job (unless, I suppose, everything fails catastrophically, but that’s certainly not the desired outcome – if I just wanted “a job,” I would just do that instead of this).
So what holds me accountable then? Since the stakes are so much lower, why would I try to honor any sort of quality bar? Well, I’d like to think that there are people that would stand by their work regardless of whether that work is tied to their real identity or not. But even discounting that, there are specific people that know who I am “IRL” who I do solicit feedback from. The people that do know me though, I believe would say that while I’m not competitive with others, I’m fiercely competitive with myself, and will try to do things “right,” whatever right means for a given problem and context. I’m certainly not perfect, but I do try!
I should say also, I don’t mean to disparage paper authors that are trying to sell an idea. Papers are, at the end of the day, a sales pitch for why the espoused technique is better than existing options, and under what conditions that holds true. My experience though, is that it can sometimes be hard to discern fact from fiction when the primary incentive of the paper author isn’t necessarily just “explain to the user the problem space and proposed solution” as opposed to all the other things a paper author may want to do.
What’s next?
More! I have a lots things I want to do:
- A physics engine: yes, I know amazing solutions like Jolt and now Box3D exist, but that won’t stop me from building my own and sharing ideas from that process with others :)
- A UI engine in the spirit of Dear Imgui but with a number of architectural differences that I’ll write about in the coming weeks hopefully (for the record, I <3 Dear Imgui but need a UI toolkit that can power the engine tooling and ship to players).
- Lots and lots of rendering and audio stuff… (to be announced later).
Some of these will be blog posts, some of these will be papers, some of these will be videos. Regardless of what comes next though, I’m excited for the journey!
Discuss this post on Patreon.